
Understand the Dashboard: deliveries, opens and clicks
What each Dashboard number means, how to compare periods and who your hot leads are.
The Dashboard is Hermod's first screen. It shows how your campaigns are doing and refreshes every 30 seconds.
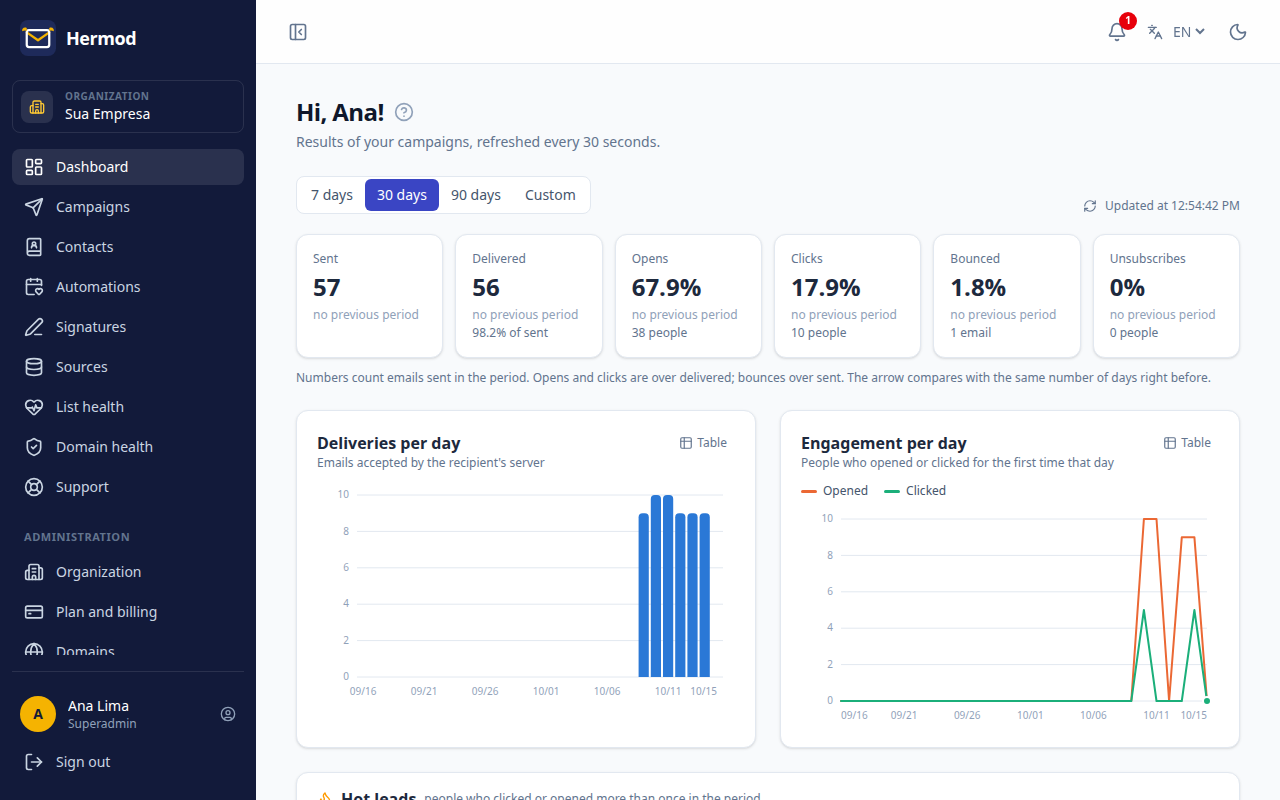
Period and source
Choose 7, 30 or 90 days or a custom period and, if you want, a specific source. The green and red arrows compare with the same number of days right before.
The numbers
| Number | What it counts |
|---|---|
| Sent | Emails sent in the period. |
| Delivered | Accepted by the recipient's server. It doesn't guarantee the inbox, but it's the first signal. |
| Opens | People who opened, out of delivered. |
| Clicks | People who clicked a link, out of delivered. |
| Bounced | Emails the recipient didn't accept (non-existent address, full mailbox…), out of sent. |
| Unsubscribes | People who asked to leave. |
Hot leads
People who clicked or opened more than once in the period. Each click is worth 5 points and each open 1 (up to 5). Activity in the last 3 days multiplies by 1.5; in the last 7, by 1.2. From 10 points on, the contact shows a flame: a great contact for your sales team.
Sending health
Shows the use of the daily limit and the signals Gmail and Microsoft watch: bounces, spam complaints and unsubscribes. If bounces or complaints go over the limit, the organization's sending is paused. See Sending rules and good delivery.